On building data-driven VC in Emerging Market firsthand
When you’re managing investments across 12+ frontier markets, you don’t get the luxury of sending analysts to every city. You either build the data tools, or you fall behind.
If you were forwarded this newsletter, consider joining over 250 weekly readers—some of the most competent tech-savvy VC professional —by subscribing here:
Over the last year, I learned this firsthand while working at the corporate venture arm of InDrive, a global ride-hailing and urban services platform operating in more than 40 countries, mostly in emerging and frontier markets. My role was to design a data-driven system that could spot early signals in places where we had no physical presence. It wasn’t a “nice-to-have.” It was the only way to keep pace.
Emerging markets don’t behave like startups in Silicon Valley. Growth is slower, capital is harder to access, and companies have to stay financially disciplined.
This makes it challenging to apply machine learning models that depend on historical growth patterns. Studying Grab’s success in Indonesia, for example, won’t necessarily help you identify another Indonesian startup on the same growth trajectory. The market penetration rates, consumer behavior, and regulatory environment shift quickly.
Where it is valuable is in spotting comparable conditions in other geographies. If we saw a certain business model gaining traction in one market, we could use those signals to explore the same thesis somewhere with similar economic and urban dynamics.
To address this, we built tools that could pull company-level data from fragmented local sources, enrich it with market indicators like smartphone penetration or GDP per capita, and layer in competitive landscape mapping. With this setup, we could run targeted searches and spot the “hidden gems” that are hungry for growth capital.
In this piece I’ll break down the systems we built, the data sources we relied on, and the patterns we learned to look for—insights that can be applied well beyond our own portfolio.
Database design
As mentioned before, we serve frontier markets, and they generally don’t have good coverage on Crunchbase or similar providers. In such contexts, building on a reliable master database is essential. Without that foundational layer, everything else, additional scrapes, semantic searches becomes noisy and hard to reconcile.
Foundational database
At the start, we weren’t entirely sure where the whole data-driven VC practice would lead us, what the precise thesis would be, or which signals would yield consistently strong results. That uncertainty made it even more important to have a broad, high-quality base to explore from and deliver results to the investment team from day 1.
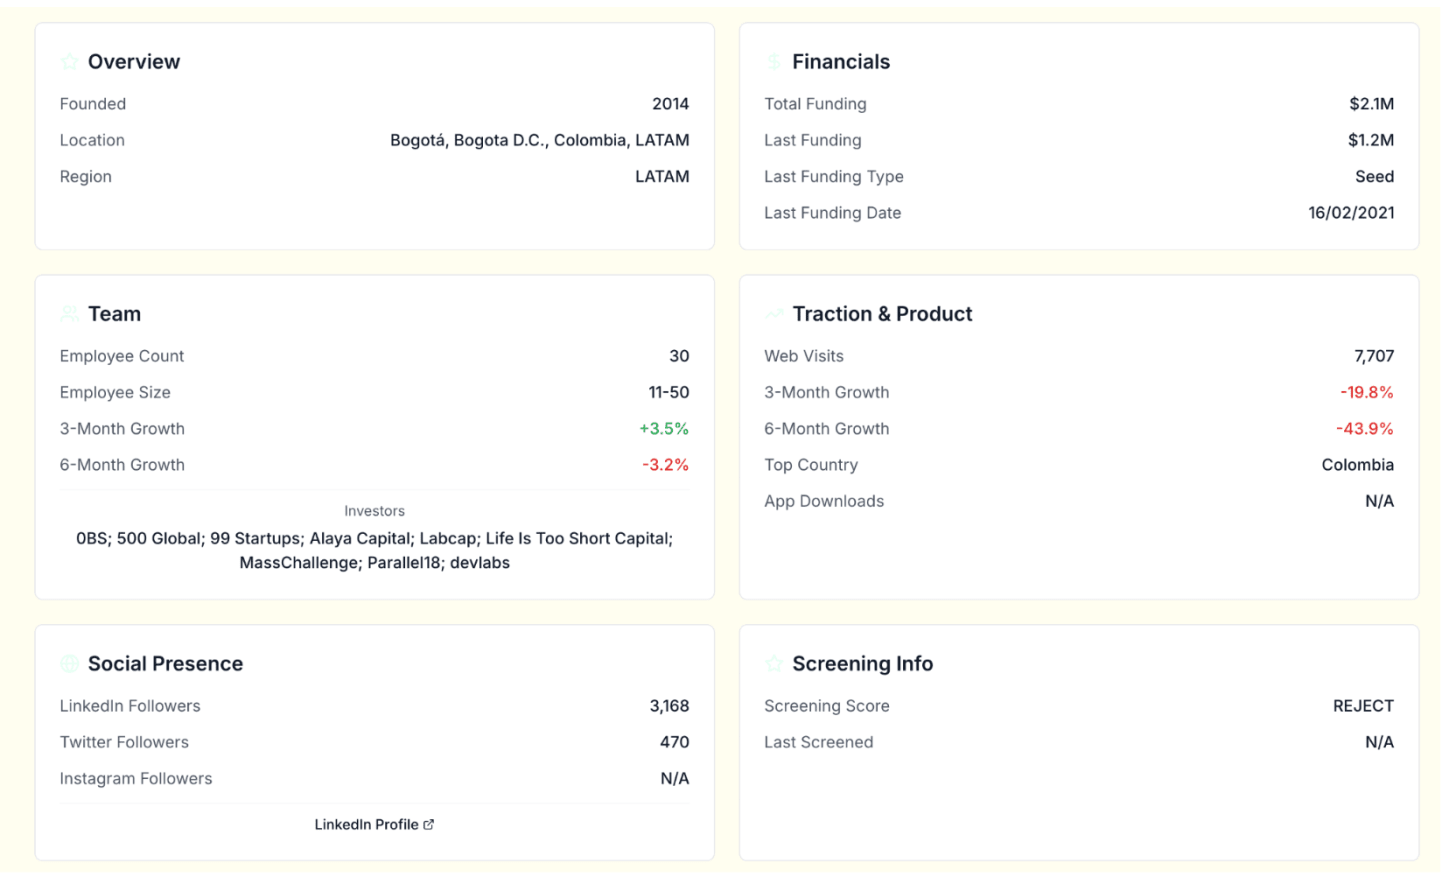
We selected Specter as our core database for its broad coverage of frontier companies and its direct data delivery to S3 buckets. This gave us normalized, clean, and well-structured data that we could treat as our system of record. From there, we could “branch out” in any direction: building web scrapers, ingesting local databases, or running semantic search.
Apart from providing the master list, Specter also supplies interesting signals worth building on. For example, alerts when someone transitions into stealth mode, or tracking engagement from known investors on LinkedIn, ie likes, follows, and comments on founder posts.
External data mining
Specter gave us a strong master list and a baseline set of firmographics, but it’s not a complete picture. In frontier markets, coverage gaps are inevitable: some startups operate under the radar, others don’t appear in global databases until they’ve already raised capital, and many change so quickly that static profiles can’t keep pace.
From there, we developed a toolkit of targeted methods for capturing both new companies and high-value signals:
Other startup databases. Occasional ad-hoc exports from Crunchbase and local sources like StartupAfrica, Magnitt, e27
Scrapping VC-funds portfolio companies. Low-hanging fruit to expand the search. We know the fund already, the LLMs do a great job of scrapping the portfolio companies pages.
LinkedIn “similar companies”. Once you have a target, LinkedIn’s similarity engine is useful for mapping competitors
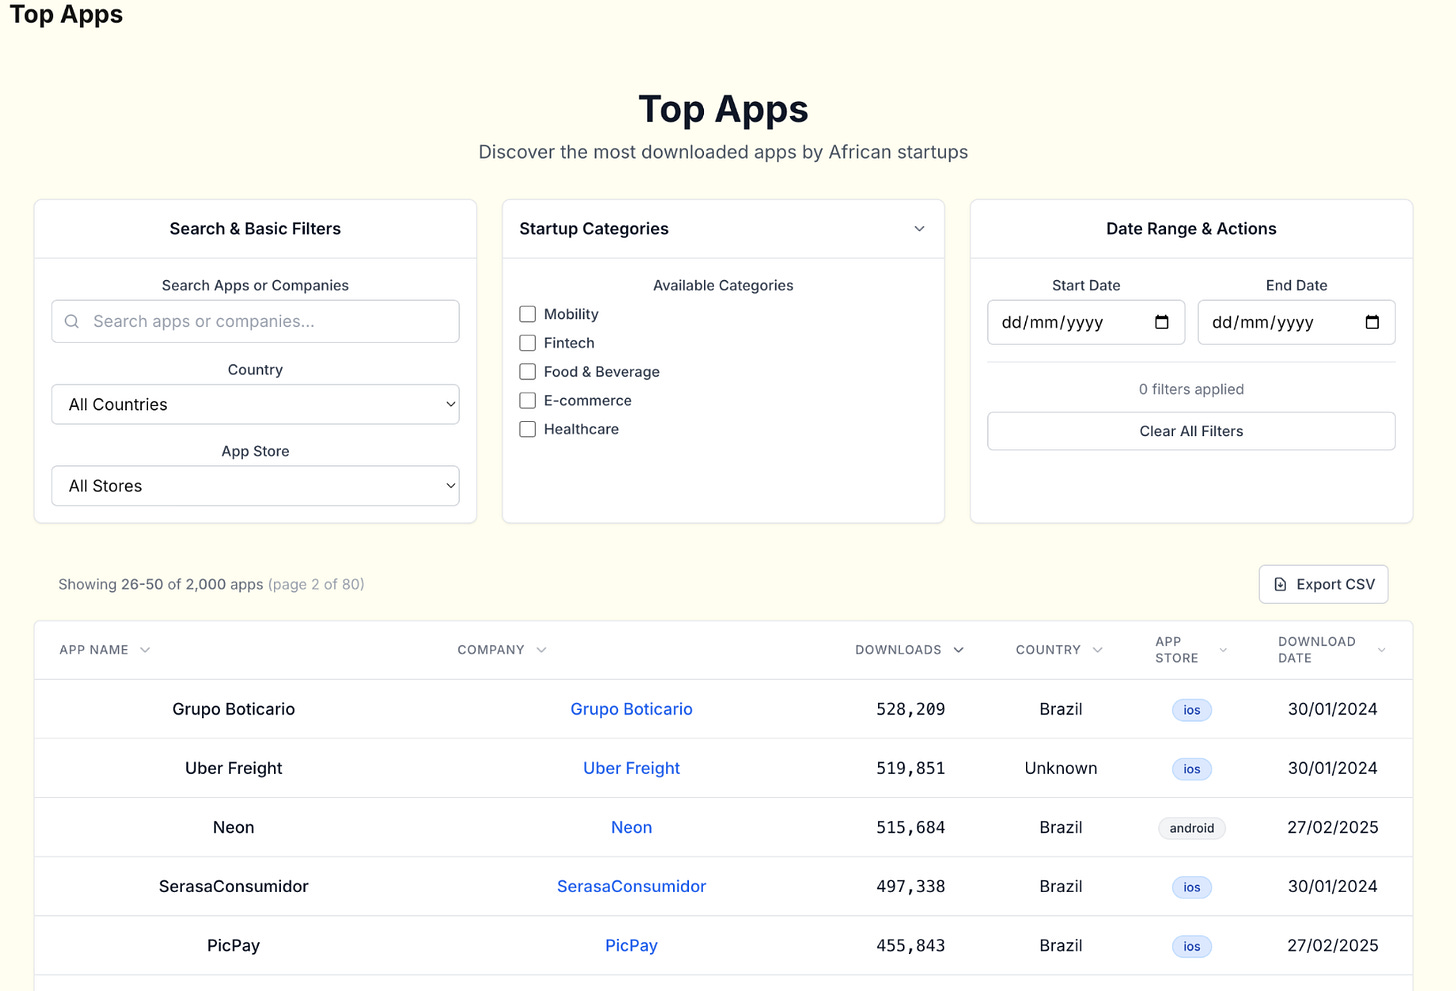
App store data. For consumer products, store analytics are a strong early indicator. Month-over-month spikes can point to traction.
Search ads (SERP) scraping. Scrapping and things like that can be handy if you want to see who's targeting the company-branded keywords and map the competitors' space.
CRM + notes. CRMs often hold proprietary data unavailable anywhere else: ARR figures, fundraising timelines, or qualitative notes on moat/positioning. The creative part of this work was extracting the data from the note taking app and enriching the proper field like ARR, headcount growth etc in the CRM. We don’t use the predefined set of questions, but if we obtain the data, we give higher priority to that. We synced operational systems bi-directionally, updating both structured metrics.
Semantic web search.This has become easier with LLMs and “deep research” agents. Helpful for finding companies in under-covered areas (e.g. try to find “grocery delivery companies in Zimbabwe” in Crunchbase). Extruct AI was helpful here. (read the interview with founder)
News data providers. Tested for monitoring purposes. But not yet scaled in our process.
Single source of truth & Embeddings
Our data model focused on four main dimensions: companies, investors, deals, and people. With multiple sources, you need to merge and deduplicate accurately.
The obvious key is domain, but companies often have multiple domains (e.g., leasy.com and leasyauto.com or fancystartup.ai and fancystartup.com) that appear in different upstream systems. Company names are unreliable (you can’t even imagine how popular the name “Yellow” for startups is). The identity was handled with a basic SCD2 setup.
For hard cases, I used text embeddings on company descriptions to propose matches and then reviewed/merged.
For embeddings creation vendor-supplied “description” text because we can’t control how it was scraped or transformed. Instead, synthesize a canonical description from first-party (CRM) /public sources we control (website, docs/blog, filings/registries). Then normalize and de-HTML the copy, handle language detection/translation for EM markets, and then ask LLM to summarize. This gave us vectors that reflected both the static database record and the company’s current public presence.
The process used:
Create embeddings from a canonical description generated ourselves (not vendor text, since we can’t control how they scrape or process it).
Run similarity search to find company pairs with the highest semantic proximity.
Manually review high-similarity matches to confirm they’re the same entity.
Merge records if confirmed, applying a field-level merge strategy. With multiple upstream sources (Specter, Crunchbase, local DBs), defined source precedence. Sometimes a simple COALESCE, other times preferring registry data over self-reported info.
Another problem is mapping the space of the the company hierarchy. There’s no other way around than map subsidiaries explicitly (e.g., Lazada → Alibaba).
Taxonomy and semantic model
Every fund sees the same company differently. A fintech lender in Kenya might be tagged as “neobank” in one portfolio, “working capital platform” in another, and “SME embedded finance” in a third. Without a taxonomy that reflects our own thesis, search and scoring become inconsistent.
We treat this as owning our semantic model: the definitions of metrics, the category tree, and the classification rules. Vendor categories are useful for coverage but are rarely specific enough. Companies might tag something as “e-commerce”, but for us that could be split into “fashion marketplaces”, “quick-commerce dark stores”, or “cross-border B2B wholesale”.
LLMs help for the taxonomy buidlings, but only after defining the model ourselves. With the right prompt, the model can take a company description, apply our definitions, and return a one-hot encoded JSON that fits our internal schema.
In practice, taxonomy is what turns a list of companies into an investment map and later can use in any fancy “talk-to-data” applciations. Without it, you are just scrolling a directory. With it, you can instantly pull every company that matches your definition of “Series A B2B marketplace in a high-import economy with logistics partnerships”, and know that the results are aligned with how your fund thinks about the world.
Tech implementation
All data landed in BigQuery, transformed with Dataform, ingested via a small set of custom ETL scripts and ad-hoc exports. The large LLM enrichment / classification / processing process where handled by serverless infrastructure, so basically run as a part of the ETL.
Basic freshness checks on key tables and SCD2 for core entities kept changes auditable.
Signals
Signals have become one of the most hyped topics in the investment tech world, but the reality is more nuanced. A single metric like “headcount growth” or “founder Twitter follower growth” rarely tells the whole story. The value comes from combining multiple signals in context. For example, a spike in engineering hires combined with an uptick in branded search traffic and a change in the pricing page.
Just use it with caution: all of that vendor’s customers get the same raw signals, and your differentiation comes from how you combine and act on them.
If you want to design an in-house signaling system from scratch, be prepared for the cost. Obtaining point-in-time historical data on headcount growth, follower counts, or website visitors and etc can easily run into six-figure contracts. And the data supply chain for signals can be messy. For most teams, especially in the early stage of building a data-driven VC practice, it makes sense to start with a vendor feed.
I think the real edge in signals coming on the monitoring side. As growth investors, we maintained a pipeline of earlier-stage companies and tracked them over time. You still own the pipeline creation but become smarter on the timing engagement.
Data Activation
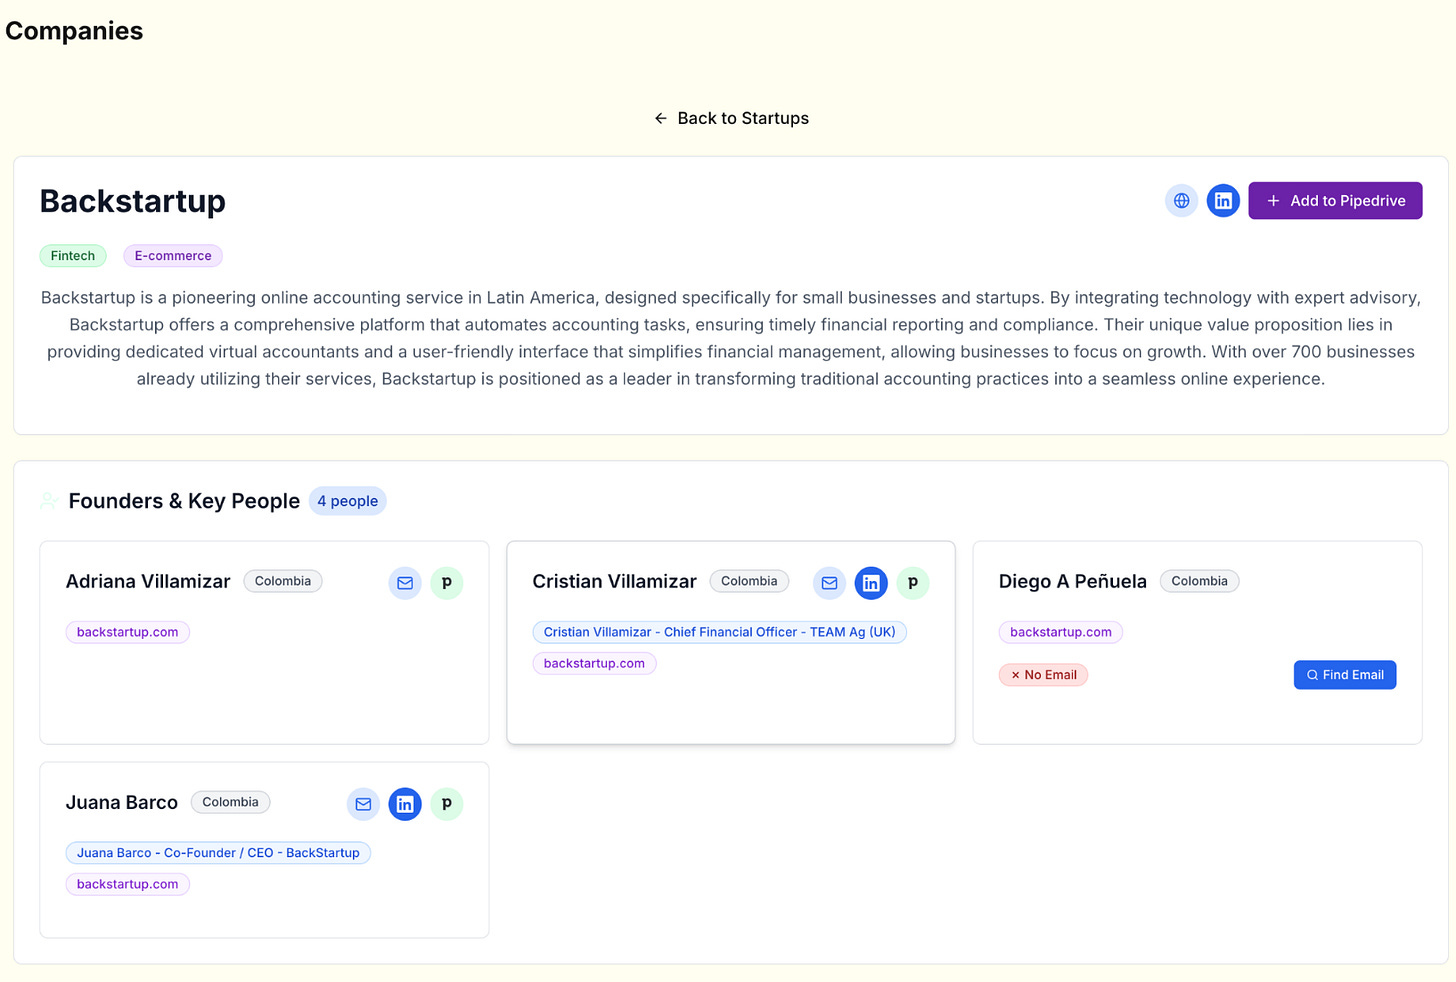
The initial stakeholder is always the investment team.For us, data activation meant turning suggestions from our platform. The goal was to collapse the gap between finding a lead and acting on it, delivering a ranked list of companies with founder contacts ready to push into the CRM.
Search
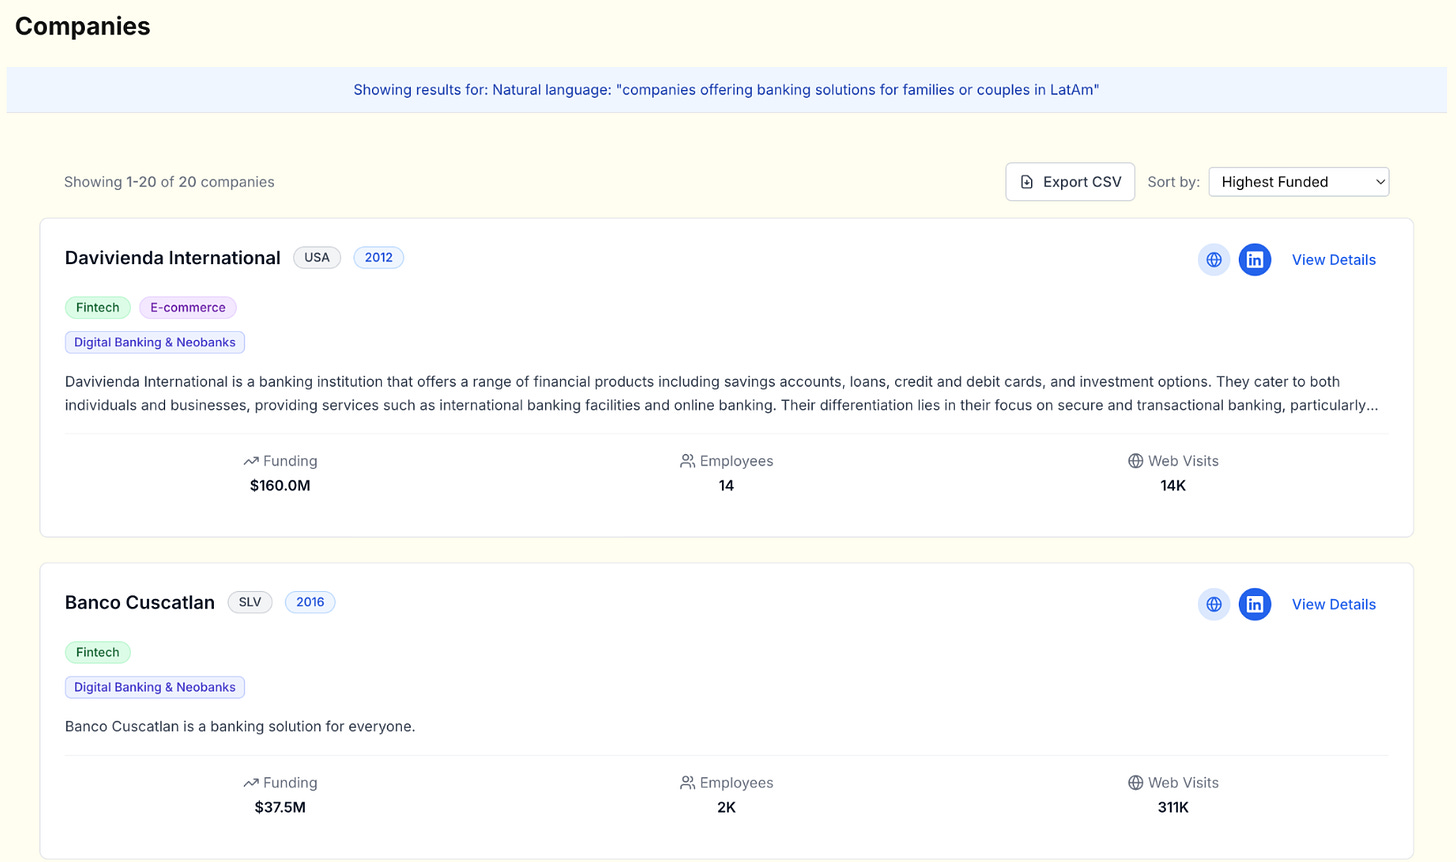
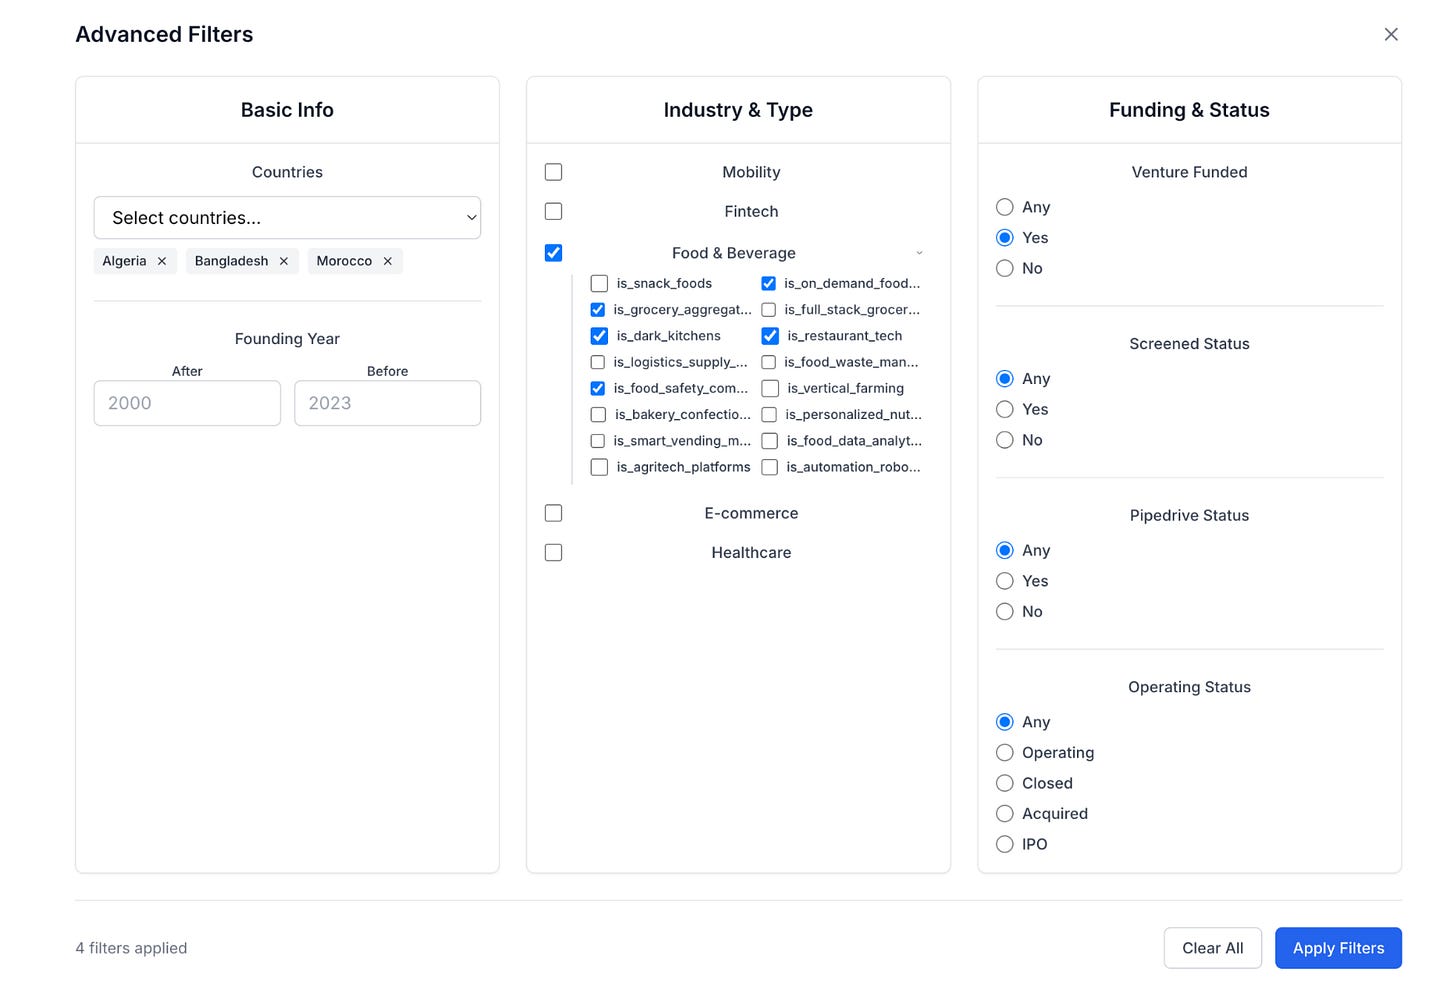
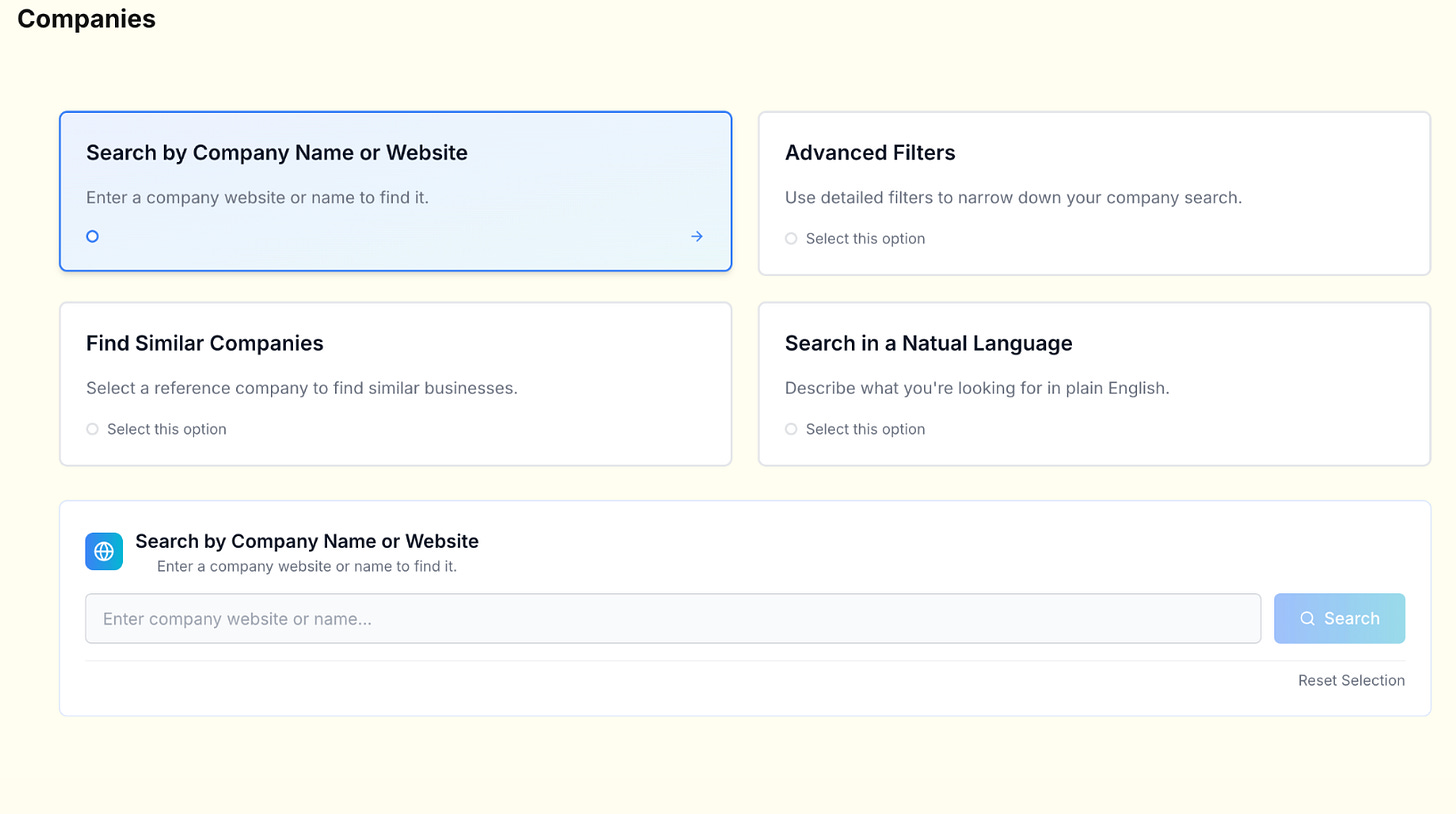
We built multiple search modes to cover different use cases. You could search by exact company name, filter based on our taxonomy, or run semantic and similarity searches.
Similarity search started with cosine similarity on company description embeddings, but we added hard-coded weights to give preference to companies of similar size in terms of funding raised and headcount. It was not the most elegant design, but it was fast, inexpensive, and effective for day-to-day prospecting.
Semantic search allowed plain-language queries across our indexed dataset. For example, an analyst could type “grocery delivery startups in Zimbabwe” and pull relevant companies even if those tags did not exist in the source database. This was particularly valuable in markets where structured data coverage was thin.
Operation
Search alone was never the end goal. Activation meant the result set had to be operational. The platform integrated contact lookups directly into the workflow, prioritizing founder or C-level details. Once a lead passed an initial review, it could be pushed to Pipedrive in one click, pre-filled with company and contact data.
For emails, implemented a fallback waterfall between two providers, ensuring the hit rate stayed high even if one vendor missed. This was essential in frontier markets where contact data is inconsistent.
At the end.
There were plenty of “interesting” things I wanted to try, like experimenting with ML models, mapping relationship-building patterns, even building a product similar to NFX Signals. But in the end, it all comes down to aligning every effort with the investment philosophy.


I find job postings really useful for understanding where a company is headed and how its business model actually works.
Also, do you include founder interviews/pitches to enrich your database?
Love this! Thx for sharing